Unified Data & BI Platform in KSA
A Unified Data & BI Platform in KSA brings information from ERP, CRM, finance, sales, and operational systems into a consistent analytics environment.
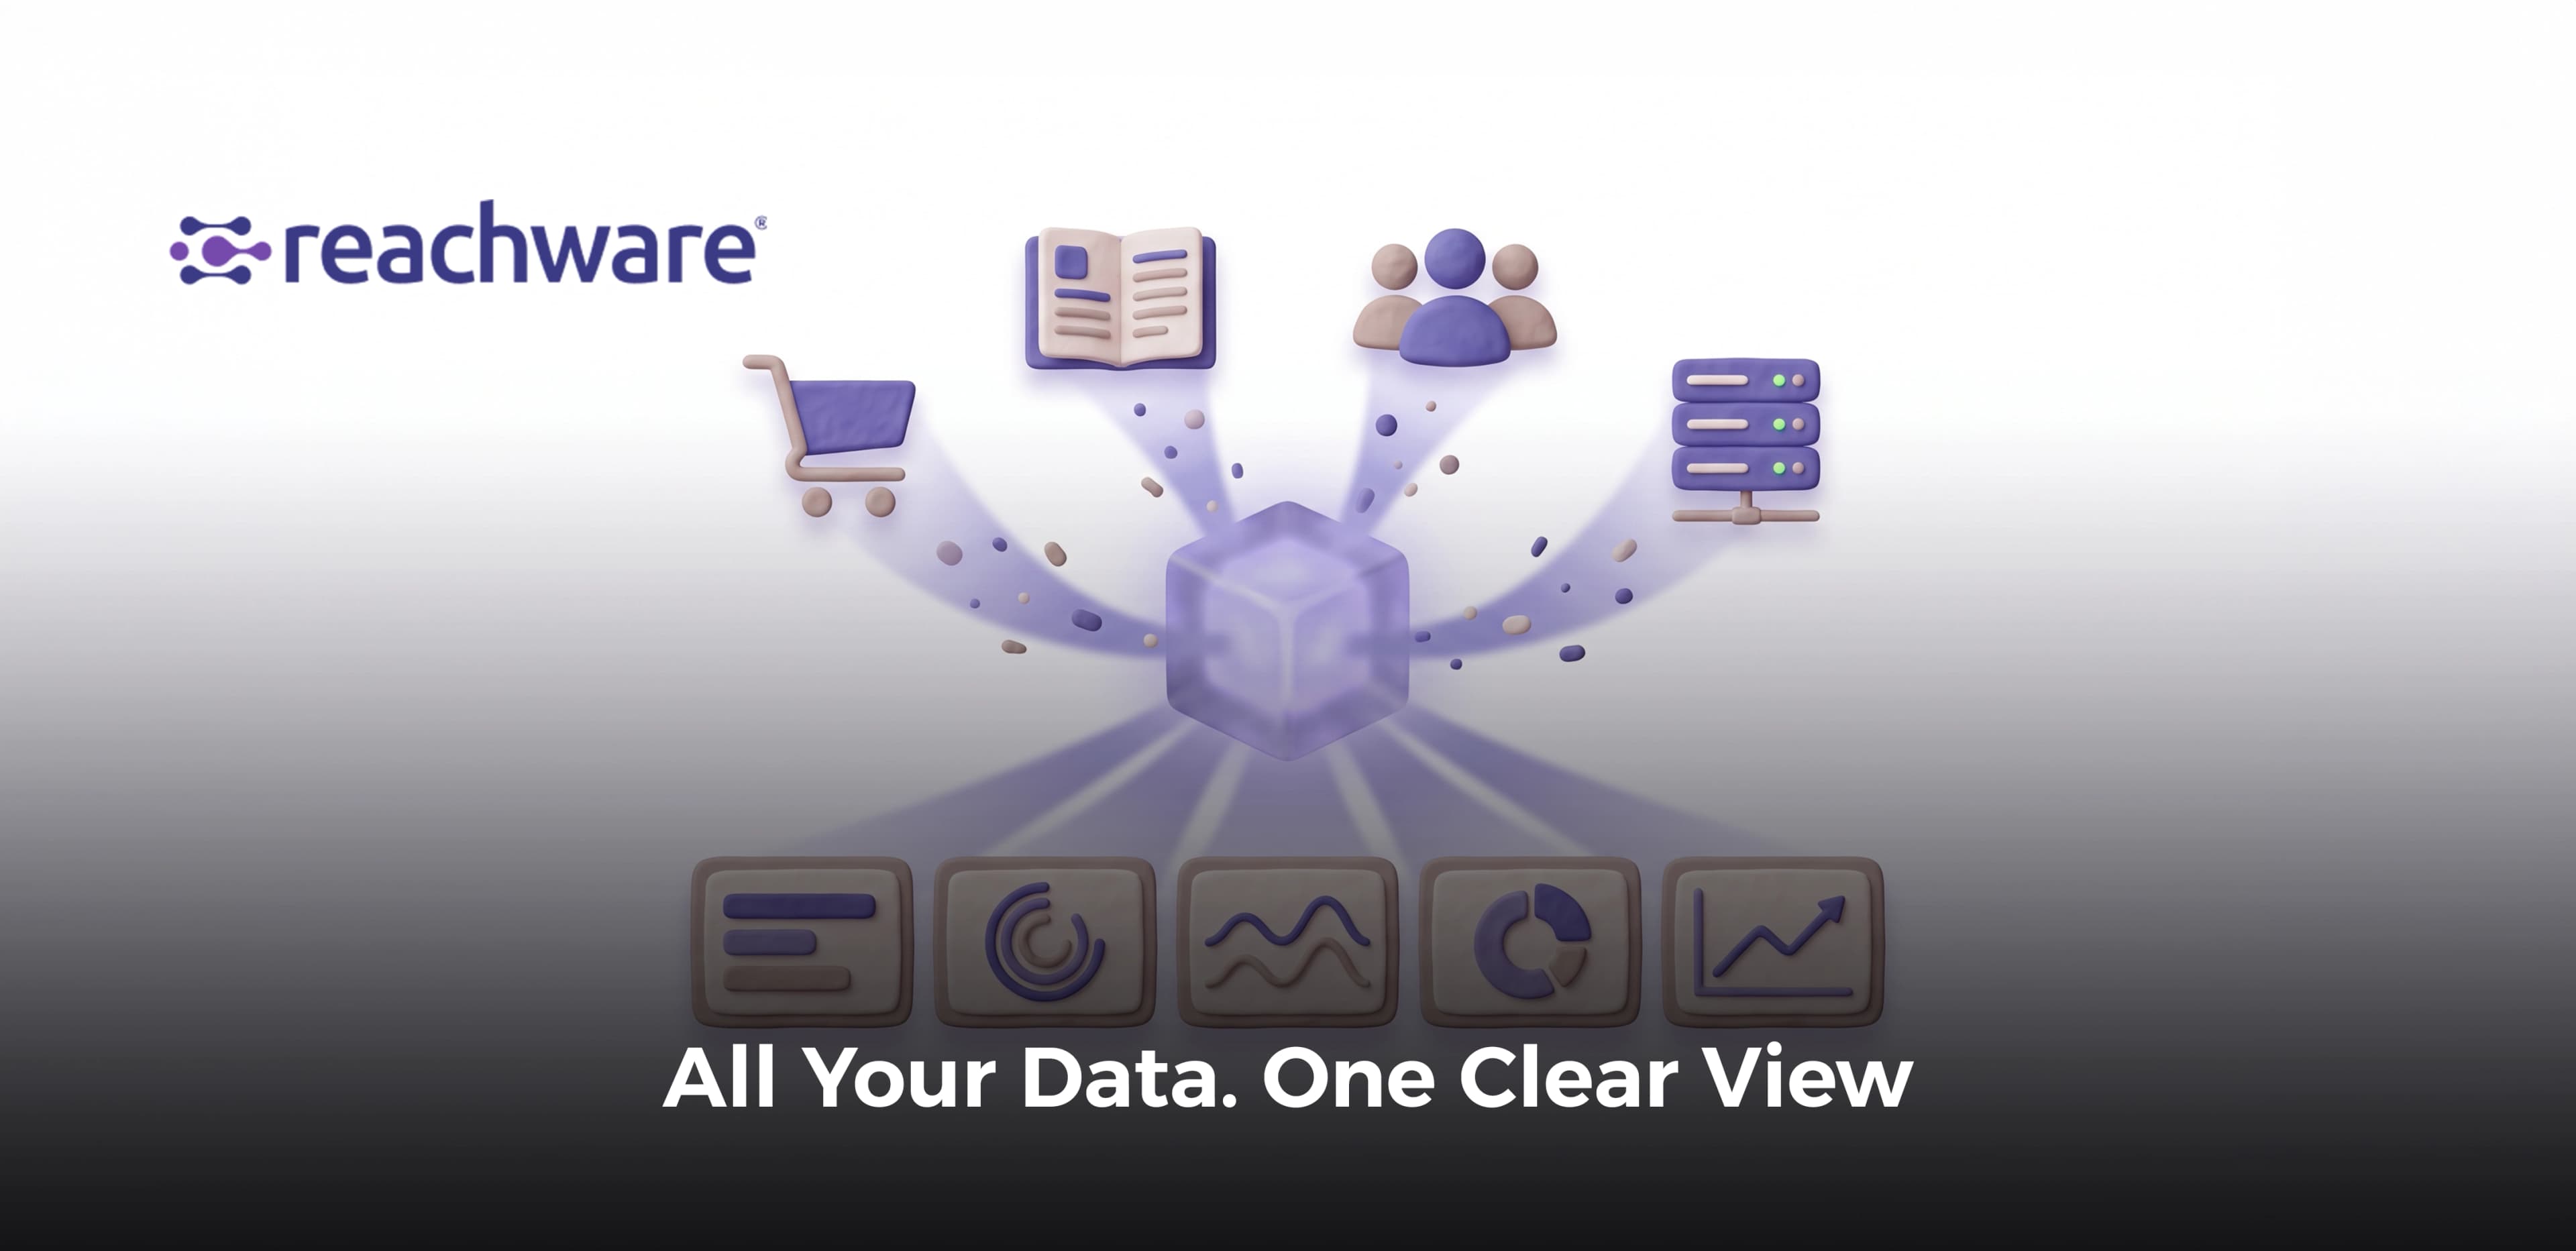
A Unified Data & BI Platform in KSA brings information from ERP, CRM, finance, sales, and operational systems into a consistent analytics environment. It uses data pipelines, master data rules, quality checks, and shared KPI definitions to create reliable dashboards and reports. Saudi businesses should begin with critical data sources, validate financial and operational figures, and select appropriate refresh schedules. This guide explains the architecture, implementation steps, governance, performance metrics, and when Reachware Insight is relevant.
Executive Summary: What Problems Does a Unified Data & BI Platform Solve?
- Fragmented business data: Sales, finance, customer service, and operations maintain information in different applications, making it difficult to understand overall business performance.
- Conflicting management reports: Different departments report different sales totals, customer counts, or operational results because they use separate data sources, filters, and calculation rules.
- Manual spreadsheet consolidation: Employees repeatedly export, clean, merge, and reconcile files before management can review performance.
- Duplicate customer and product records: ERP, CRM, and commerce systems may assign different identifiers to the same customer or product, creating unreliable totals when datasets are combined.
- Poor data quality: Missing fields, invalid identifiers, inconsistent formats, or delayed source updates reduce confidence in reports.
- Unclear KPI definitions: Teams may use the same metric name while calculating different values, such as gross sales versus net sales or booked revenue versus collected cash.
- Outdated dashboards: Reports may display information from an earlier refresh without making the last successful update or data-coverage period visible.
- Limited financial and operational visibility: Business leaders cannot easily connect revenue, expenses, customer activity, inventory, and fulfillment outcomes.
- Unvalidated forecasts: Predictive outputs may appear convincing without historical testing, accuracy measurement, or documentation of underlying assumptions.
- Inconsistent access permissions: Users may receive broader access to customer, employee, or financial information than their business responsibilities require.
- Difficult analytics expansion: Every new branch, business system, or management report may require custom data preparation if pipelines and metric definitions are not reusable.
- Unclear data ownership: No department is accountable for resolving mismatches or approving the meaning of shared records and indicators.
What should the organization establish first?
- A defined source of authority: Identify the application responsible for each customer, product, transaction, and financial record.
- Reliable data pipelines: Extract or receive approved information, transform it consistently, and deliver it to the designated analytics environment.
- Shared master data: Connect equivalent customer, product, branch, and legal-entity identifiers without inventing matches.
- A governed KPI dictionary: Define every critical metric, its calculation, exclusions, owner, reporting period, and refresh frequency.
- Validated dashboards: Publish only approved indicators with appropriate access controls, source traceability, and visible freshness information.
- Measurable data quality: Track completeness, consistency, uniqueness, validity, timeliness, and accuracy using agreed tests.
The objective is not simply to put every database in one location. It is to create a trustworthy analytical view while the underlying operational and financial applications retain responsibility for their original records.
Unifying Operational and Financial Data Sources
1. Connect ERP, CRM, Sales, and Operational Applications
A unified BI architecture brings relevant information from different business applications into a consistent reporting process. It should preserve the meaning of each record rather than treating related events as identical.
For example, a CRM opportunity represents a potential sale, an ERP invoice documents a financial transaction, a payment provider records payment activity, and a warehouse application tracks physical stock movements. Combining these events requires approved relationships and calculation rules.
Key integration requirements include:
- ERP records: Import approved sales orders, invoices, expenses, product information, inventory values, and organizational structures needed for reporting.
- CRM records: Obtain customer accounts, opportunities, pipeline stages, and service information using consistent identifiers.
- Commerce and POS data: Capture channel sales, order lines, promotions, refunds, and relevant branch information.
- Operational systems: Bring in warehouse movements, delivery outcomes, production activities, or service performance where these are important to management.
- External data: Incorporate approved market, campaign, or partner datasets only when the business purpose, quality, and usage rights are clear.
2. Build Data Pipelines with Appropriate Refresh Frequency
Data pipelines collect, validate, transform, and load information from source systems into an analytics environment. They may use application interfaces, database replication, file transfers, or supported event streams.
A business should choose the processing frequency based on how quickly decisions must be made—not because every dashboard needs continuous updates.
- Batch pipelines: Suitable for approved daily sales reports, periodic expense analysis, and information that becomes final after a scheduled accounting process.
- Incremental pipelines: Transfer changed records rather than repeatedly processing the full historical dataset, where the source and architecture support this method.
- Event-driven pipelines: Useful when operational events must trigger prompt analytical updates and reliable event delivery is available.
- Hybrid pipelines: Combine prompt operational indicators with periodic financial close data or other datasets that should not be treated as continuously final.
- Pipeline monitoring: Record run status, row counts, data coverage, processing timestamps, failures, and recovery outcomes.
- Reprocessing controls: Define how corrected or late-arriving records update previous reporting periods without creating duplicates.
3. Standardize Master Data Across Systems
Master data refers to shared business entities such as customers, products, branches, suppliers, and legal entities. Master Data Management (MDM) defines how these entities are identified and governed across applications.
The analytics layer needs consistent identifiers even when source systems use different numbering conventions.
- Customer matching: Maintain approved relationships between CRM account IDs, ERP customer IDs, and commerce references.
- Product matching: Link SKU variants, internal product IDs, and marketplace listing codes without combining distinct products incorrectly.
- Branch and location structures: Standardize branch, city, warehouse, and operating-region classifications.
- Legal entity boundaries: Preserve the distinction between subsidiaries, ownership structures, currencies, and reporting responsibilities.
- Reference-data definitions: Use approved values for order status, sales channel, customer category, and other shared dimensions.
- Data stewardship: Assign responsibility for reviewing duplicate, conflicting, and unmatched master records.
4. Reconcile Financial and Operational Information
Operational reports and financial statements can legitimately present different values because they describe different stages of a business process.
A unified platform should explain these differences instead of forcing the totals to match through unsupported adjustments.
- Orders versus recognized revenue: A confirmed customer order does not necessarily meet the accounting requirements for revenue recognition.
- Payments versus sales: A payment settlement may be affected by fees, refunds, timing differences, or other adjustments.
- Stock movements versus inventory valuation: Warehouse quantities and ERP inventory values represent different aspects of inventory reporting.
- Returns versus refunds: A physical return and the transfer of money back to a customer may occur at different times.
- Current versus closed periods: Preliminary daily figures should be distinguished from finalized financial reporting.
- Reconciliation exceptions: Investigate missing, duplicated, or unmatched transactions using the original record references.
5. Define the Analytical Data Flow
A practical architecture can use separate layers for collecting source information, validating it, and preparing approved reporting models. This reduces the risk of dashboards relying directly on inconsistent operational records.
Reference data flow:
ERP + CRM + POS + warehouse and other approved sources → secure ingestion and data pipelines → raw data retention → cleaning and master-data matching → reconciliation and data-quality checks → curated analytical models → governed KPIs → management dashboards, reports, and authorized forecasting processes.
This architecture can be implemented with a data warehouse, lakehouse, or another appropriate analytical design. A unified platform does not require every company to purchase the same combination of technologies.
BI Dashboard Architecture and Data Quality
A reliable BI dashboard depends on the quality and structure of the data behind it. The architecture should separate data collection, validation, analytical modeling, metric definitions, and visualization so errors can be located and corrected without changing every report independently.
1. Organize Data into Raw, Validated, and Reporting Layers
One established option is a layered architecture commonly described as Bronze, Silver, and Gold.
- Raw layer: Retains source records and available extraction details so teams can verify what originally arrived.
- Validated layer: Standardizes data types, resolves approved identifiers, applies business rules, and separates invalid records for investigation.
- Curated layer: Organizes trusted, business-ready datasets and calculations for reporting and analytics.
- Historical handling: Preserves appropriate versions when customer classifications, organizational structures, or other attributes change over time.
- Source traceability: Allows analysts to follow a reported value back through transformations to its originating source.
2. Build a Shared Semantic Model and KPI Definitions
A semantic model gives business users a consistent interpretation of data. Instead of allowing each dashboard author to reconstruct sales or customer metrics independently, the organization defines approved relationships and measures once.
- Fact tables: Hold measurable events, such as order lines, invoices, transactions, or delivery attempts, at a clearly defined level of detail.
- Dimension tables: Describe the customer, product, branch, time period, and other attributes used to filter and group measures.
- Metric formulas: Specify numerator, denominator, filters, units, rounding, and treatment of canceled or incomplete transactions.
- Time conventions: Document transaction dates, reporting periods, time zones, and the treatment of historical corrections.
- Metric ownership: Assign a responsible business team to approve definitions and changes.
- Metric reuse: Use the same governed calculation across executive, department, and branch dashboards wherever the business meaning is the same.
3. Test Data Quality Before Publishing Dashboards
Data quality should be assessed through measurable rules rather than a general statement that the data is accurate.
The following checks help analytics teams identify which records are suitable for reporting.
- Accuracy: Does a value agree with an approved authoritative record or another reliable validation source?
- Completeness: Are required fields and eligible records present?
- Consistency: Do related records agree across sources after applying approved business definitions?
- Validity: Do data types, formats, ranges, and business conditions meet the documented requirements?
- Uniqueness: Are records that should be unique free from unintended duplicates?
- Timeliness: Was the data updated within the freshness requirement for its intended decision?
When a dataset fails an important check, the reporting process should flag, quarantine, or qualify affected results according to business-approved rules instead of silently presenting them as reliable.
4. Design Dashboards for Decisions, Not Just Visualization
An effective dashboard makes it clear what is happening, why the information matters, and where the user can investigate further.
- Executive dashboards: Focus on a limited set of approved business outcomes, trends, comparisons, and exceptions.
- Finance dashboards: Distinguish booked activity, recognized results, collected cash, expenses, and finalized reporting periods.
- Operations dashboards: Show throughput, inventory, service delays, backlog, and exception rates at the relevant location or process level.
- Sales dashboards: Connect pipeline activity with approved sales results without combining opportunities and completed transactions.
- Drill-down capability: Allow authorized users to move from consolidated results to relevant branch, product, customer, or transaction details.
- Freshness indicators: Display the latest confirmed refresh and reporting period so users can judge whether a number is current enough for the decision.
Comprehensive BI Architecture and Data Quality Decision Table
Component | Main responsibility | Typical source or input | Validation requirement | Business output |
ERP connector | Obtain approved enterprise records | ERP | Correct entity, period, and permissions | Finance and operations data |
CRM connector | Obtain customer and opportunity records | CRM | Stable customer IDs and valid stages | Sales and customer analysis |
Commerce ingestion | Import orders and sales activity | Storefront or POS | Order completeness and channel identity | Channel-level reporting |
Warehouse ingestion | Import inventory and fulfillment events | WMS | SKU, location, and event consistency | Stock and fulfillment analysis |
Financial ingestion | Import approved finance records | Accounting applications | Reconciliation and closing status | Financial reporting inputs |
Batch pipeline | Process scheduled updates | API, file, or database | Completed run and expected coverage | Periodic datasets |
Incremental pipeline | Process changed records | Supported change source | Watermarks and late corrections | Efficient updates |
Event pipeline | Process eligible business events | Event stream or webhook | Deduplication and ordering | Prompt operational updates |
Raw data layer | Preserve original extracts | Ingested data | Source traceability | Audit and reprocessing inputs |
Validation layer | Clean and standardize information | Raw records | Data-quality checks | Reliable conformed records |
Master data matching | Connect equivalent entities | ERP/CRM/product catalogs | Approved matching and uniqueness | Consistent business dimensions |
Reconciliation | Identify differences across records | Multiple authoritative sources | Count and value comparisons | Investigable exceptions |
Historical modeling | Preserve time-dependent attributes | Source changes | Correct effective dates | Comparable historical reports |
Curated data layer | Prepare analytics-ready information | Validated records | Approved aggregation and grain | Trusted analytical datasets |
Semantic model | Define business relationships | Curated facts and dimensions | Relationship and filter tests | Reusable reporting model |
KPI dictionary | Establish metric meaning | Business definitions | Formula and owner approval | Consistent calculations |
Dashboard layer | Display approved metrics | Semantic model | Filter, totals, and access tests | Management insights |
Forecasting process | Produce and evaluate predictions | Approved historical dataset | Backtesting and error metrics | Qualified forecasts |
Access control | Restrict information | User identities and policies | Role and scope testing | Authorized consumption |
Data lineage | Trace reported values | Pipeline and model metadata | Verified source mapping | Accountability |
Pipeline monitoring | Detect processing failures | Run logs and events | Freshness and completeness checks | Operational alerts |
Data-quality monitoring | Track recurring defects | Quality-rule results | Defined thresholds and owners | Remediation priorities |
Governance catalog | Document assets and ownership | Data catalog and glossary | Current definitions and owners | Discoverable trusted data |
Audit and retention | Preserve approved evidence | Processing and access records | Policy and regulatory review | Traceability and control |
5. Choose the Right Freshness and Reporting Model
Not every business metric should be described as real time. Some figures change throughout the day, while others depend on end-of-day adjustments or formal financial approval.
Reporting approach | Appropriate use | Primary advantage | Important limitation |
Scheduled dashboard refresh | Daily or periodic management reporting | Predictable update and validation cycle | Information changes between refreshes |
Incremental refresh | Growing datasets with identifiable changes | Can reduce repeated full-data processing | Needs reliable change tracking |
Direct or live query | Selected analytical needs requiring current source information | Can avoid duplicating some datasets | Dependent on source performance and model design |
Streaming or event-driven analytics | Operational events needing prompt attention | Faster event visibility when supported | Duplicate events, ordering, and quality remain concerns |
Hybrid reporting | Operational metrics combined with approved financial data | Matches freshness to business requirements | Different metrics may have different cutoffs |
A dashboard is only as current as the relevant source, pipeline, analytical model, and visualization refresh path. A fast refresh cannot compensate for missing or incorrect source records.
Management Use Cases for Reachware Insight
Reachware Insight is presented as a business intelligence platform for bringing multiple sources into dashboards, creating custom reports, supporting self-service exploration, and using AI-assisted analytics. These published functions make it relevant to enterprise management reporting, while particular connectors, processing methods, and deployment controls must be confirmed for each organization.
1. Executive Performance Visibility
A leadership dashboard can bring together approved commercial, financial, and operational KPIs to help executives assess performance across business units.
- Compare revenue and operating indicators across authorized regions, branches, and reporting periods.
- Identify changes in financial and operational performance using approved calculations.
- Highlight exceptions requiring investigation, such as unexpected expense increases or fulfillment delays.
- Present the last refresh date and reporting status to distinguish preliminary figures from approved results.
Management decision supported: Which business unit requires investigation, additional resources, or a change in operating priorities?
2. Financial and Commercial Performance
Finance leaders need to understand how commercial activity relates to recognized financial results without treating every sales event as a completed accounting transaction.
- Compare approved actuals against budget or forecast at the appropriate reporting level.
- Analyze changes in revenue, expense categories, gross margin, and other relevant financial measures.
- Identify unexplained differences between commercial reports and financial records.
- Review customer and product performance using approved classification rules.
Management decision supported: Which financial variances are material, and what explains them?
3. Sales and Customer Analytics
Sales and commercial leaders can analyze customer activity, pipeline movement, and completed sales using consistent identifiers and definitions.
- Evaluate qualified opportunities and stage conversions within the CRM pipeline.
- Compare pipeline results with approved downstream transactions without counting them as the same event.
- Identify customer segments and channels with changing sales or service patterns.
- Monitor the completeness and consistency of customer records used in the analysis.
Management decision supported: Which sales segments or processes need intervention?
4. Inventory and Supply Chain Monitoring
Operations managers can combine inventory and order information to investigate stock availability, fulfillment delays, and supplier performance.
- Compare demand patterns with available inventory and replenishment information.
- Monitor aging stock, stockouts, or slow-moving products using approved definitions.
- Compare fulfillment performance by warehouse, branch, and product category.
- Identify mismatches between operational stock reports and ERP records.
Management decision supported: Where should inventory and operational capacity be adjusted?
5. Forecasting and Scenario Evaluation
Predictive analytics may help estimate demand or identify patterns, but forecasts require separate validation before management relies on them.
- Prepare a historical dataset with consistent reporting periods and product or business classifications.
- Separate training information from later evaluation periods to test performance on unseen observations.
- Compare predictions with simple baselines, such as previous-period or seasonal forecasts.
- Measure forecast error and investigate bias across branches, products, and periods.
- Document limitations, assumptions, and situations in which forecasts should not guide automated decisions.
Management decision supported: Are the predictions sufficiently reliable to inform planning, or does the model need further validation?
The ability to produce a forecast is not proof that it will outperform a simpler method or improve business results.
Implementation Blueprint and Data Flow: Step by Step
A unified BI project should start with one approved management question and a limited set of reliable data sources. The team can then establish ownership, design pipelines, build a consistent data model, validate results, and expand dashboards after business users confirm that the numbers are correct.
1. Step One: Define Business Questions and Reporting Scope
- Select the management decision: Identify the question the first dashboard must answer, such as which branches are missing sales targets or where operating costs are rising.
- Identify the required KPIs: Document the exact metrics, reporting periods, comparison groups, and filters necessary to answer that question.
- Choose a manageable pilot: Begin with one business unit, reporting process, or department instead of integrating every available dataset.
- Record the current baseline: Measure report preparation time, data discrepancies, refresh delays, and manual reconciliation work.
2. Step Two: Inventory Data Sources and Assign Owners
- List participating applications: Document ERP, CRM, sales platforms, financial systems, warehouse applications, and any approved external sources.
- Map authoritative records: Determine which application controls the official value for each business entity or measure.
- Identify technical access: Document available APIs, database interfaces, exports, permissions, and source update schedules.
- Assign stewards: Identify the business owner responsible for validating each dataset and resolving important discrepancies.
3. Step Three: Design Data Pipelines and Storage
- Choose ingestion methods: Select secure APIs, approved replication, files, or supported event streams according to source capabilities.
- Select processing frequency: Use batch, incremental, streaming, or hybrid processing based on the decisions the data supports.
- Define raw data retention: Keep the necessary original records and extraction metadata for traceability and controlled reprocessing.
- Plan for late changes: Decide how refunds, corrected invoices, edited customer records, and backdated transactions affect historical results.
4. Step Four: Standardize Master Data
- Map entity identifiers: Create approved relationships between ERP and CRM customer IDs, product SKUs, branch identifiers, and legal entities.
- Identify duplicates: Apply documented matching rules and review uncertain cases before consolidation.
- Harmonize reference values: Standardize currencies, units, categories, statuses, dates, and organizational classifications.
- Preserve history: Record effective dates where changes to products, customers, branches, or categories affect past analysis.
5. Step Five: Implement Data Quality and Reconciliation Rules
- Check required fields: Reject or flag records that cannot support the intended calculation.
- Check expected volumes: Compare extracted record counts with source totals where appropriate.
- Validate relationships: Identify transactions referencing customers, products, or branches that cannot be matched.
- Reconcile important totals: Compare analytical sales and financial figures with their approved source reports, accounting for documented scope differences.
- Route exceptions: Assign unresolved data defects to the responsible source-system owner or data steward.
6. Step Six: Build the Analytical and Semantic Models
- Set the grain: Define whether each fact represents an order, order line, invoice line, daily balance, or another measurable event.
- Create dimensions: Establish customer, product, branch, channel, and date structures for consistent analysis.
- Define relationships: Verify joins and filters to prevent double counting or loss of records.
- Approve measures: Document the calculation and business meaning of every KPI.
- Test historical behavior: Ensure corrections and changing master data do not distort earlier reporting periods.
7. Step Seven: Design Dashboards and Access Controls
- Match information to the user: Design executive, financial, commercial, and operational views around their specific decisions.
- Present context: Include reporting period, comparison baseline, measure definition, and last confirmed refresh.
- Enable appropriate analysis: Provide filters and drill-downs only where users have the required permissions.
- Protect sensitive information: Apply approved role-based restrictions and any additional row- or column-level controls supported by the selected architecture.
- Review usability: Test readability, navigation, and performance with actual management users.
8. Step Eight: Validate Reporting and Forecasts
- Compare dashboard figures: Reconcile important metrics against approved financial or operational source reports.
- Test edge cases: Include missing products, duplicated customers, returns, canceled orders, and backdated corrections.
- Check reporting periods: Confirm time-zone handling, closing dates, and the distinction between preliminary and finalized results.
- Validate forecasts: Use historical holdout periods, backtesting, and appropriate error metrics before allowing predictive outputs to influence decisions.
- Obtain business approval: Require the responsible data and KPI owners to sign off on the reporting results.
9. Step Nine: Launch, Monitor, and Scale
- Run a controlled pilot: Release the initial dashboard to a defined set of authorized users.
- Monitor freshness and quality: Track pipeline completion, last available data, rule failures, and unresolved exceptions.
- Collect management feedback: Identify whether the dashboard improves the targeted decision-making workflow.
- Expand by domain: Add new branches, datasets, and KPIs only after validating their relationships and definitions.
- Maintain governance: Review access, metric definitions, source-system changes, and forecast performance over time.
End-to-End Reference Data Flow
ERP, CRM, POS, warehouse, and approved external sources → authenticated extraction → raw data layer → cleaning and master-data matching → quality checks and reconciliation → curated data warehouse or lakehouse → shared semantic model and KPI definitions → authorized dashboards and reports → forecast validation and management decisions.
Failed validation should create an exception that can be investigated. It should not automatically transform unreliable source values into approved figures.
Failure Modes, Security, Governance, and Validation
A unified BI environment can spread inaccurate information quickly when source records, transformations, or KPI definitions are incorrect. Reliable analytics therefore requires data-quality monitoring, secure access, clear ownership, and ongoing validation of the results presented to business users.
1. Data Pipeline and Modeling Failure Modes
Prevent incomplete and duplicated analytical records
- Missing source records: Compare ingestion counts, time ranges, and source completeness before approving a reporting dataset.
- Duplicate ingestion: Use stable keys and processing controls to prevent retries or repeated extracts from inflating totals.
- Incorrect joins: Validate relationships between fact and dimension tables, especially where several records share similar identifiers.
- Late corrections: Define how amended orders, returns, and financial adjustments update previously published figures.
- Schema changes: Detect new, renamed, or removed source fields before they cause silent reporting errors.
Prevent misleading dashboards
- Metric inconsistency: Publish approved calculations centrally instead of allowing each report to define financial or operational measures independently.
- Stale information: Display the last confirmed refresh and alert responsible teams when data exceeds its freshness threshold.
- Mixed reporting periods: Distinguish current operational data from previous-month or finalized financial records.
- Incorrect aggregation: Test whether summing or averaging a measure across branches, customers, or periods is mathematically and commercially appropriate.
- Unqualified forecasts: Label predictive outputs clearly and provide evidence of model validation before using them for significant decisions.
2. Security and Data Protection
Secure data collection and storage
- Least-privilege access: Grant each pipeline and service account only the data and operations required for its approved purpose.
- Credential protection: Store connection secrets securely and establish rotation and revocation procedures.
- Encryption: Protect information in transit and at rest using appropriate controls and service capabilities.
- Sensitive-data classification: Identify customer, employee, and confidential financial information before sharing it with reporting systems.
- Access logging: Preserve relevant evidence of data access and administrative changes while avoiding unnecessary exposure of personal information.
Protect the consumption layer
- Role-based permissions: Restrict management, department, branch, and analyst access according to documented responsibilities.
- Row- and column-level restrictions: Apply detailed controls where sensitive data requires them and the platform supports them.
- Export restrictions: Review who may download, share, or embed reports containing confidential information.
- Embedded dashboard security: Validate user identity and authorization when analytics are displayed inside other applications.
- Saudi regulatory review: Assess applicable PDPL requirements and data governance obligations before introducing new data flows, processors, or cross-border transfers.
3. Data Governance and KPI Ownership
Establish responsibility for trusted data
- Source-system owner: Confirms what the underlying record represents and approves changes to its definition.
- Data engineer: Maintains ingestion, transformation logic, pipeline operations, and technical monitoring.
- Data steward: Reviews data quality, master-data matching, and unresolved discrepancies.
- KPI owner: Approves metric formulas, reporting periods, exclusions, and any calculation changes.
- BI administrator: Controls published models, dashboard access, release processes, and reporting availability.
Maintain governance throughout the lifecycle
- Business glossary: Document the meaning of important fields, categories, and business terms.
- Data catalog: Keep an inventory of approved sources, datasets, analytical models, and reports.
- Data lineage: Record how a reported value moves and changes from source to dashboard.
- Version control: Review modifications to transformations and KPI calculations before deployment.
- Retention policies: Determine how raw, curated, historical, and audit data should be retained.
- Change communication: Notify affected report users when important metric definitions or historical figures change.
4. Validation and Forecast Monitoring
Verify published information
- Financial reconciliation: Compare relevant analytical totals against approved ERP or financial results.
- Record completeness: Confirm that all eligible source transactions are represented according to the reporting scope.
- Time consistency: Test date boundaries, late-arriving records, and reporting-period rules.
- User acceptance: Ask finance, operations, or sales owners to validate reports using real business scenarios.
- Regression testing: Recheck important reports when source systems, transformations, or semantic models change.
Validate predictive analytics
- Historical backtesting: Compare predictions with later observed values using periods not included in model training.
- Baseline comparison: Check whether the predictive approach performs better than a simple, appropriate alternative.
- Error metrics: Use measures such as WAPE, MAE, or RMSE according to the business problem and the characteristics of the data.
- Forecast bias: Identify persistent overestimation or underestimation across important products, branches, and periods.
- Model drift: Monitor whether accuracy declines as demand patterns or operating conditions change.
- Decision controls: Require human review for high-impact actions unless automated decisions have been separately authorized and validated.
Data Risk and Validation Matrix
Risk | Possible business consequence | Preventive control | Validation evidence |
Duplicate sales records | Inflated revenue dashboard | Stable transaction keys | Duplicate-count test |
Missing CRM records | Incomplete customer analysis | Completeness and reconciliation checks | Source-to-target comparison |
Incorrect master-data mapping | Customers or products counted incorrectly | Approved matching rules | Sampled relationship audit |
Failed pipeline | Stale management report | Run monitoring and alerts | Last successful load |
Wrong reporting period | Inaccurate monthly comparison | Time and period rules | Period reconciliation |
Invalid metric formula | Conflicting executive KPIs | Central calculation approval | KPI acceptance test |
Incorrect fact-table grain | Double counting | Model design and relationship tests | Reconciliation by transaction |
Unapproved financial adjustments | Misleading financial totals | Finance-owned reconciliation | Approved financial comparison |
Unauthorized dashboard access | Exposure of confidential information | Access controls | Permission test |
Sensitive-data export | Privacy or confidentiality risk | Export and sharing controls | Access and audit review |
Source schema change | Broken transformations | Contract monitoring and testing | Regression results |
Unvalidated forecast | Poor planning decisions | Backtesting and benchmark comparison | Forecast error report |
Forecast drift | Declining prediction reliability | Periodic performance monitoring | Error trend |
Unclear data ownership | Persistent unresolved discrepancies | Stewardship and escalation | Ownership register |
Untracked dashboard changes | Conflicting results between teams | Version control and release approval | Change history |
Saudi Arabia Use Cases and Measurable KPIs
Saudi enterprises can apply unified data and BI architecture to business processes where financial, commercial, and operational information must be compared across departments, cities, and systems. The value of the platform depends on consistent definitions and trustworthy datasets—not simply the number of charts or connectors available.
- Retail and e-commerce: Combine approved sales, inventory, fulfillment, returns, and customer data to evaluate performance across channels and stores.
- Distribution and wholesale: Compare orders, product availability, delivery outcomes, supplier activity, and finance records across branches and customers.
- Manufacturing: Monitor production output, downtime, inventory, quality checks, and costs using appropriately validated source systems.
- Logistics: Analyze delivery completion, operational delays, capacity utilization, and service performance.
- Professional services: Compare approved sales pipelines, project progress, utilization, expenses, and billing data.
- Construction: Bring together approved project milestones, procurement records, supplier performance, and financial reporting.
- Multi-branch organizations: Provide leadership with consistent KPIs across Riyadh, Jeddah, Dammam, and other operating locations while preserving legal-entity distinctions.
- Budget and forecasting: Compare actual outcomes with approved budgets and validated forecasts to support planning and resource allocation.
- Executive reporting: Reduce reliance on disconnected spreadsheets and give authorized leaders shared definitions and traceable results.
- Data governance improvement: Identify repeated quality problems and assign their correction to responsible business teams.
Illustrative Saudi Enterprise Use Case
Consider a hypothetical Saudi retailer operating branches in Riyadh, Jeddah, and Dammam. Its ERP records approved financial and inventory activity, CRM holds customer relationships, and POS systems record branch transactions.
Before the unified reporting project, managers download separate spreadsheets to compare sales, refunds, inventory, and customer activity. Different departments use inconsistent product classifications and may report different net sales totals.
The company starts with one reporting domain: daily commercial performance across the three cities.
The technical team establishes approved source connections, standardizes branch and product identifiers, maps the relevant sales and returns records, and defines a common net-sales calculation.
The business then validates the curated figures against approved source reports before publishing an executive dashboard.
Illustrative data flow:
ERP + POS + CRM → secure data pipelines → source validation → master-data matching → sales and returns reconciliation → curated analytical model → net-sales KPI → branch dashboard → management review.
This is an illustrative use case, not a documented Reachware customer implementation.
Example: Comparing Sales Performance Across Branches
Assume a hypothetical reporting period with the following approved figures, expressed in Saudi riyals, and measured on a consistent, pre-VAT basis:
City | Sales before returns | Approved returns | Net sales |
Riyadh | SAR 2,400,000 | SAR 120,000 | SAR 2,280,000 |
Jeddah | SAR 1,500,000 | SAR 75,000 | SAR 1,425,000 |
Dammam | SAR 1,100,000 | SAR 55,000 | SAR 1,045,000 |
Total | SAR 5,000,000 | SAR 250,000 | SAR 4,750,000 |
Net sales = Sales before returns − Approved returns.
This simplified example assumes the company's definition is based on comparable sales and returns, before VAT, without other relevant adjustments. Real financial reporting may require discounts, revenue-recognition rules, cutoffs, or other approved adjustments.
KPIs for Measuring BI and Data Quality Performance
KPI | Calculation or measurement | Business purpose |
Data completeness rate | Valid eligible records with all required fields ÷ eligible records examined × 100 | Measures reporting readiness |
Data uniqueness rate | Unique eligible business records ÷ eligible records checked × 100 | Highlights unintended duplication |
Cross-system match rate | Approved matched records ÷ eligible records requiring matching × 100 | Measures master-data consistency |
Reconciliation pass rate | Datasets or periods passing agreed reconciliation checks ÷ total tested × 100 | Measures trust in reported totals |
Pipeline success rate | Successful scheduled pipeline executions ÷ eligible scheduled executions × 100 | Measures processing reliability |
Pipeline freshness | Time since the latest confirmed valid source update or completed processing event, as defined | Measures timeliness |
Pipeline recovery time | Average time needed to restore failed eligible processing | Measures operational resilience |
Data quality exception rate | Records failing agreed quality rules ÷ eligible records checked × 100 | Identifies recurring defects |
KPI definition coverage | Critical KPIs with approved formulas and owners ÷ total critical KPIs × 100 | Measures reporting governance |
Dashboard availability | Time authorized users can access the required reporting service ÷ agreed service time × 100 | Measures service availability |
Dashboard adoption | Active authorized users ÷ intended authorized users × 100 | Evaluates actual usage |
Report preparation time | Staff hours required to prepare an approved recurring report | Measures administrative effort |
Reporting discrepancy rate | Reported values failing agreed comparison checks ÷ values tested × 100 | Monitors reporting consistency |
Forecast WAPE | Sum of absolute forecast errors ÷ sum of absolute actuals × 100, where denominator is nonzero | Measures aggregate forecast error |
Forecast bias | Sum of forecast values minus actual values, divided by an agreed appropriate denominator | Identifies systematic over- or underestimation |
Data access violations | Number of confirmed unauthorized access incidents | Measures security control outcomes |
Unresolved data issues | Count and age of outstanding data-quality exceptions | Measures governance workload |
Example 1: Calculating Data Completeness
Assume the analytics team checks 5,000 eligible records and finds that 4,920 contain all required fields.
Data completeness rate = (4,920 ÷ 5,000) × 100 = 98.4%.
The remaining 80 records require classification. Some may need correction in the source application, while others may be legitimately outside the agreed reporting requirements.
Example 2: Calculating Pipeline Reliability
Assume 60 pipeline executions were scheduled and 58 completed successfully under the defined operating criteria.
Pipeline success rate = (58 ÷ 60) × 100 = 96.67%.
This result describes pipeline execution, not the accuracy of the records delivered. Data validation and business reconciliation are separate controls.
Example 3: Validating Forecast Accuracy
Assume a demand forecast was evaluated against three subsequent observed periods:
Period | Actual demand | Forecast demand | Absolute error |
1 | 100 | 110 | 10 |
2 | 150 | 130 | 20 |
3 | 250 | 260 | 10 |
Total | 500 | 500 | 40 |
WAPE = (Sum of absolute errors ÷ Sum of absolute actuals) × 100.
WAPE = (40 ÷ 500) × 100 = 8%.
Although the total forecast equals the total actual demand in this example, individual period errors still exist. Therefore, comparing only overall totals would conceal forecast errors.
WAPE is undefined when the denominator is zero. Analytics teams should also examine forecast bias, performance by segment, and backtesting results before relying on a model.
Saudi Data Governance Considerations
Saudi organizations should assess the applicable Personal Data Protection Law (PDPL), its implementing regulations, and relevant national data governance rules when combining personal information across systems.
The business should document which records contain personal data, where that data is processed, who may access it, and whether cross-border transfers or other regulatory obligations require additional safeguards.
A unified BI solution does not automatically establish legal compliance merely because it includes access controls or centralized reporting.
Where Reachware Fits and When to Request a Demo
Reachware Insight is positioned as a business intelligence and analytics platform that combines data sources, presents information in dashboards, supports customized reporting, offers self-service analysis, and describes AI-powered and embedded analytics capabilities.
Those functions make the product relevant to companies exploring more consistent reporting and management insights. However, the exact scope of connectors, data pipelines, master-data management, forecasting methods, and deployment controls must be confirmed through a technical evaluation.
1. How Reachware Insight Relates to Unified BI
- Integration and visualization: Reachware describes combining multiple data sources into understandable dashboards. Buyers should verify which source applications, versions, and data-access methods are supported.
- Custom reporting: The product is presented as enabling reports aligned with individual business objectives. A demonstration should show the required company-specific KPIs and filters.
- Self-service analytics: Reachware promotes independent data exploration. Governance should still determine which datasets and metrics individual users may access.
- AI-powered insights: The published product information describes pattern detection and predictive analytics. Customers should assess model inputs, validation methods, explainability, and operational limitations.
- Embedded analytics: Reachware describes placing analytics inside other applications. Implementation details and user-level access controls should be verified for the intended environment.
2. When Should a Company Consider Reachware Insight?
A tailored product demonstration becomes useful when:
- Management receives conflicting dashboards from different departments.
- ERP, CRM, and operational data must be analyzed together.
- Report preparation depends heavily on spreadsheets and manual reconciliation.
- Analytics teams need reusable, governed KPI definitions.
- Business units need customized and authorized management views.
- Predictive reporting is being considered, but the company requires evidence of forecast reliability.
- The organization wants to compare BI solutions using actual data sources and operational requirements.
3. How to Evaluate Reachware Insight Against Other BI Approaches
The terms "business intelligence software tools Saudi Arabia" cover several categories of solutions, including dashboard software, integrated analytics platforms, data warehouses, lakehouses, and specialized data-management tools.
These components may overlap, but they do not necessarily provide identical capabilities.
Evaluation area | Dashboard-focused BI tool | Broader analytics architecture | What to demonstrate with Reachware Insight |
Business dashboards | Core capability | Uses a presentation layer | Required executive and department dashboards |
ERP/CRM connectivity | Depends on available connectors | Can use separate pipelines | Exact supported data sources |
Data transformation | May offer preparation functions | Dedicated transformation pipelines possible | Mapping and transformation scope |
Master data matching | Often needs external governance | Can include MDM workflows | How equivalent customers and products are handled |
Data quality validation | Varies by product | Can enforce pipeline quality rules | Required checks and exception handling |
Financial reconciliation | Usually requires defined business logic | Can use approved reconciliation processes | Correct treatment of sales, returns, and finance figures |
KPI governance | Shared measures may be available | Governed semantic models and catalogs | Metric definitions, owners, and reuse |
Refresh options | Product-dependent | Batch, incremental, event, or hybrid | Actual freshness and technical limitations |
Drill-down and self-service | Common BI functions | Depends on presentation layer | Authorized user exploration |
Forecasting | Availability varies | May use separate analytical models | Forecast workflow and validation evidence |
Embedded analytics | Varies by provider and plan | Can expose governed reporting services | Embedded access and security model |
Security and access | Vendor and configuration dependent | End-to-end architecture responsibility | Role permissions and data handling |
Monitoring | Dashboard service monitoring | Pipeline and platform observability | Visibility into failed or delayed datasets |
Cost | Licensing and deployment | Infrastructure, tools, staffing, support | Full implementation and operating assumptions |
A company should not assume that a BI visualization product replaces an enterprise data warehouse, MDM solution, or integration platform. Instead, it should identify which architectural functions are provided by the selected offering and which remain the responsibility of other systems.
4. What Should the Reachware Demonstration Prove?
- Source compatibility: Connect to the actual ERP, CRM, finance, and operational systems required for the pilot.
- Data consistency: Show how source identifiers, duplicate records, and important classification differences are addressed.
- KPI accuracy: Recreate an approved financial or operational metric and compare it with the authoritative report.
- Dashboard flexibility: Demonstrate relevant filters, time periods, branch comparisons, and accessible drill-downs.
- Data freshness: Explain the refresh method, timing, limitations, and how failed updates appear to users.
- Access restrictions: Test the permissions of an executive, branch manager, analyst, and other relevant roles.
- Forecast validation: If predictive analytics is in scope, show historical evaluation, error metrics, and the limitations of generated forecasts.
- Support and costs: Identify the services, development responsibilities, operating requirements, and commercial assumptions.
For a deeper discussion of predictive applications, read Reachware's guide to real-time business analytics in Saudi Arabia.
To evaluate the product using your organization's actual data and reporting requirements, explore business intelligence and analytics with Reachware Insight or request a tailored demonstration.
Frequently Asked Questions About Unified Data and BI in Saudi Arabia
1. What is a Unified Data & BI Platform in KSA?
It is an analytical environment that combines data from business applications, standardizes important records, applies quality rules, and presents approved information through dashboards and reports. Its exact architecture depends on the organization's sources, systems, and reporting needs.
2. What is real-time business analytics?
Real-time business analytics analyzes information with sufficiently low delay to support time-sensitive decisions. The actual freshness depends on source events, pipelines, processing, analytical models, and dashboard updates. Not every metric requires real-time processing.
3. How can dashboards combine data from ERP and CRM?
Approved data pipelines retrieve ERP and CRM information, map related identifiers, standardize business attributes, and prepare validated analytical models. Dashboards then use shared relationships and KPI definitions to present the combined information.
4. How should businesses assess data quality?
Assess accuracy, completeness, consistency, validity, uniqueness, and timeliness using explicit rules and measurable tests. Track failures, assign business owners, and investigate material discrepancies before approving the affected dashboard.
5. What is the role of master data in BI?
Master data provides consistent definitions and identifiers for shared entities such as customers, products, suppliers, branches, and legal entities. It helps prevent duplicates and incorrect relationships when reports combine information from separate systems.
6. Are data pipelines and dashboards the same thing?
No. Data pipelines move and transform information, while dashboards present approved analytical results to users. They are different components of the reporting process, even when supplied within one product ecosystem.
7. Does a unified BI platform replace ERP or CRM?
No. ERP and CRM remain responsible for their assigned operational and business records. The BI environment organizes relevant information for reporting and analysis.
8. How often should BI dashboards refresh?
Refresh frequency should match the business decision. Operational exceptions may need prompt updates, while finance and budget reporting may rely on scheduled or finalized datasets. Every dashboard should communicate its data coverage and freshness.
9. How are KPI definitions standardized?
Create an approved metric dictionary that includes each KPI's formula, source, owner, reporting period, filters, exclusions, and treatment of changes. Publish consistent measures through the analytical model wherever possible.
10. How can businesses validate predictive forecasts?
Evaluate forecasts against later observed outcomes using historical holdout periods or backtesting. Compare performance with appropriate baselines and error metrics such as WAPE, MAE, or RMSE, and monitor accuracy over time.
11. What should Saudi companies check when choosing BI software?
They should verify source connectivity, data quality, KPI governance, security, access controls, reporting flexibility, refresh requirements, implementation costs, and applicable Saudi data-protection obligations. A pilot with real business data is more useful than a generic product demonstration.
12. When should a business evaluate Reachware Insight?
Reachware Insight is worth evaluating when management needs consistent dashboards, customized reporting, cross-system analysis, or governed access to business insights. Product suitability should be established using the company's actual systems, metrics, and acceptance criteria.